


Written by Noah Carl.
For the past few years, one of the main talking points on the environmentalist side of the race and IQ debate has been GCSE results—specifically, the fact that White British pupils perform worse than ethnic minorities. (GCSEs are compulsory exams taken at age 16 in England and Wales.) In the 2023 data, the average score for White British is lower than the averages for Chinese, Indian, Pakistani, Bangladeshi and Black.1
These results have been discussed in the British press since at least 2010, but they were first brought to widespread attention in HBD circles by the Zambian scholar Chanda Chisala, who said they constituted “definitive proof” that Richard Lynn had “grossly underestimated” Africans’ genotypic IQ. Harvard professor Sasha Gusev has repeatedly cited them, claiming that “the entire hereditarian project is built on these slippery claims that collapse under the smallest amount of scrutiny”. They even turned up in a hit piece against Nathan Cofnas published in the Cambridge student newspaper.
Those who’ve been following the debate closely will be aware that the GCSE results do not in fact refute hereditarianism.
In a series of papers, John Fuerst and colleagues analysed a huge amount of actual IQ data from the UK, and found that the average scores for different ethnic groups are basically in line with expectations. Chinese score highest, followed by Whites and Indians. And then Bangladeshis, Pakistanis and Blacks score lower. Interestingly, the Black–White IQ gap is somewhat lower in Britain than it is in the US: about 7–10 points, rather than the usual 15 (most likely due to selective immigration).
What’s more, Cremieux managed to track down a dataset with both GCSE grades and IQ test scores for the same individuals, namely the Millennium Cohort Study. (Participants were given various cognitive tests as part of the study, and their educational outcomes were linked to the dataset.) He was able to show that Black Africans score about 7 IQ points lower than Whites, despite having the same average GCSE grades. This confirms that ethnic disparities in GCSE results are biased indicators of ethnic disparities in intelligence.
It also rules out the theory that disparities in the GCSE results are primarily due to the exclusion of pupils at independent (i.e., private) schools from the national figures.2 Some people had hypothesised that the average for White British is so low because the smartest White Brits all attend private schools—Eton and Harrow and other lesser-known establishments. Yet this was never very likely: less than 10% of pupils attend private schools, and their ethnic mix is not substantially different from that of state schools. (The stereotype that such institutions are bastions of “white privilege” is outdated.)
With all that said, the GCSE results are still a puzzle. It is certainly unusual for groups that score lower on IQ tests to score higher on school exams. I took the GCSEs back in 2006 and, while I got good marks, I wouldn’t call them a piece of cake (I felt like they tested both my knowledge and my intelligence). In fact, Ian Deary and colleagues examined the individual-level relationship between IQ and GCSE grades using 2002 data, and obtained an impressive correlation of r = .81.
In this article, I will present some additional evidence that the GCSE results do not refute hereditarianism. I will also outline a theory that attempts to explain all the data.
An obvious question to ask at the outset is: have the results always been this way? Did White British pupils always do worse than ethnic minorities? The answer is no. The earliest data I could find are from 1991, and they show the following rank order: 1) Other Asian, 2) Indian, 3) White, 4) Pakistani, 5) Black, 6) Bangladeshi—with sizeable gaps between Whites and the latter three groups.3 It was not until 2009 that any of those groups achieved the same average grades as Whites. And it was not until 2013 that Black Africans were discernibly ahead. (Even today, Black Caribbeans lag behind.)
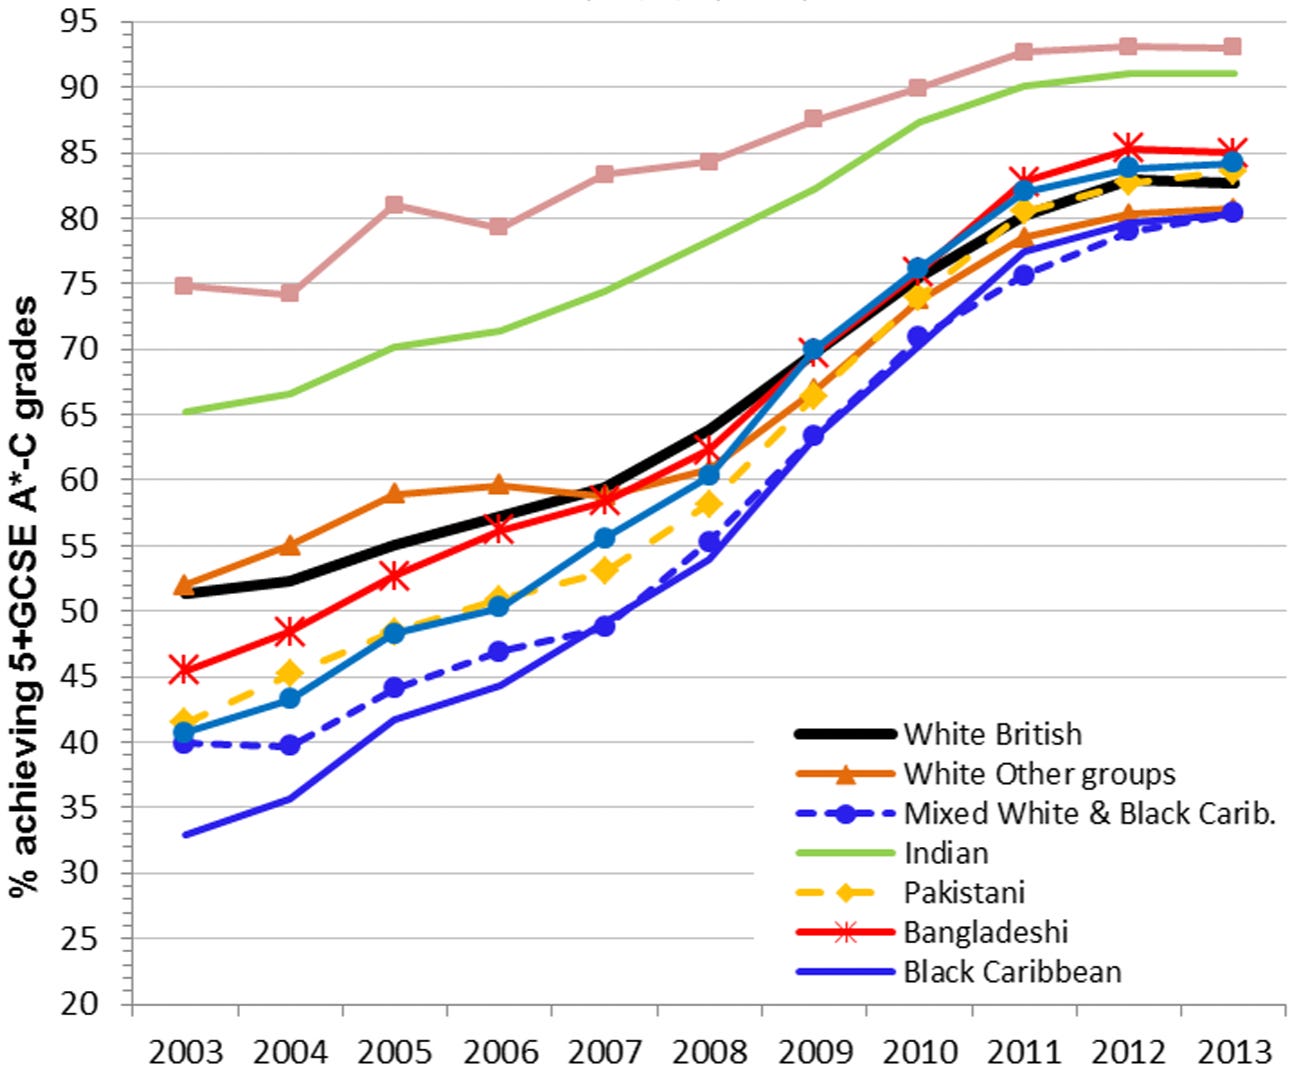
As Steve Strand noted in a major report published in 2015, the White advantage over Pakistanis, Bangladeshis and Blacks was lost gradually, beginning in the late 1990s. It’s not that there was a sudden shift in one particular year that could be chalked up to, say, methodology.
For my first analysis, I looked at whether GCSE performance in 1991 is better “predicted” by GCSE performance in 2023 or by average IQ. Average IQs were taken from Table 1 of this paper. All the values are based on large samples of educational or occupational selection tests that were administered in the 21st century. GCSE performance in 1991 was taken from p. 24 of this report, while GCSE performance in 2023 was taken from here. Figures were available for six ethnic groups.
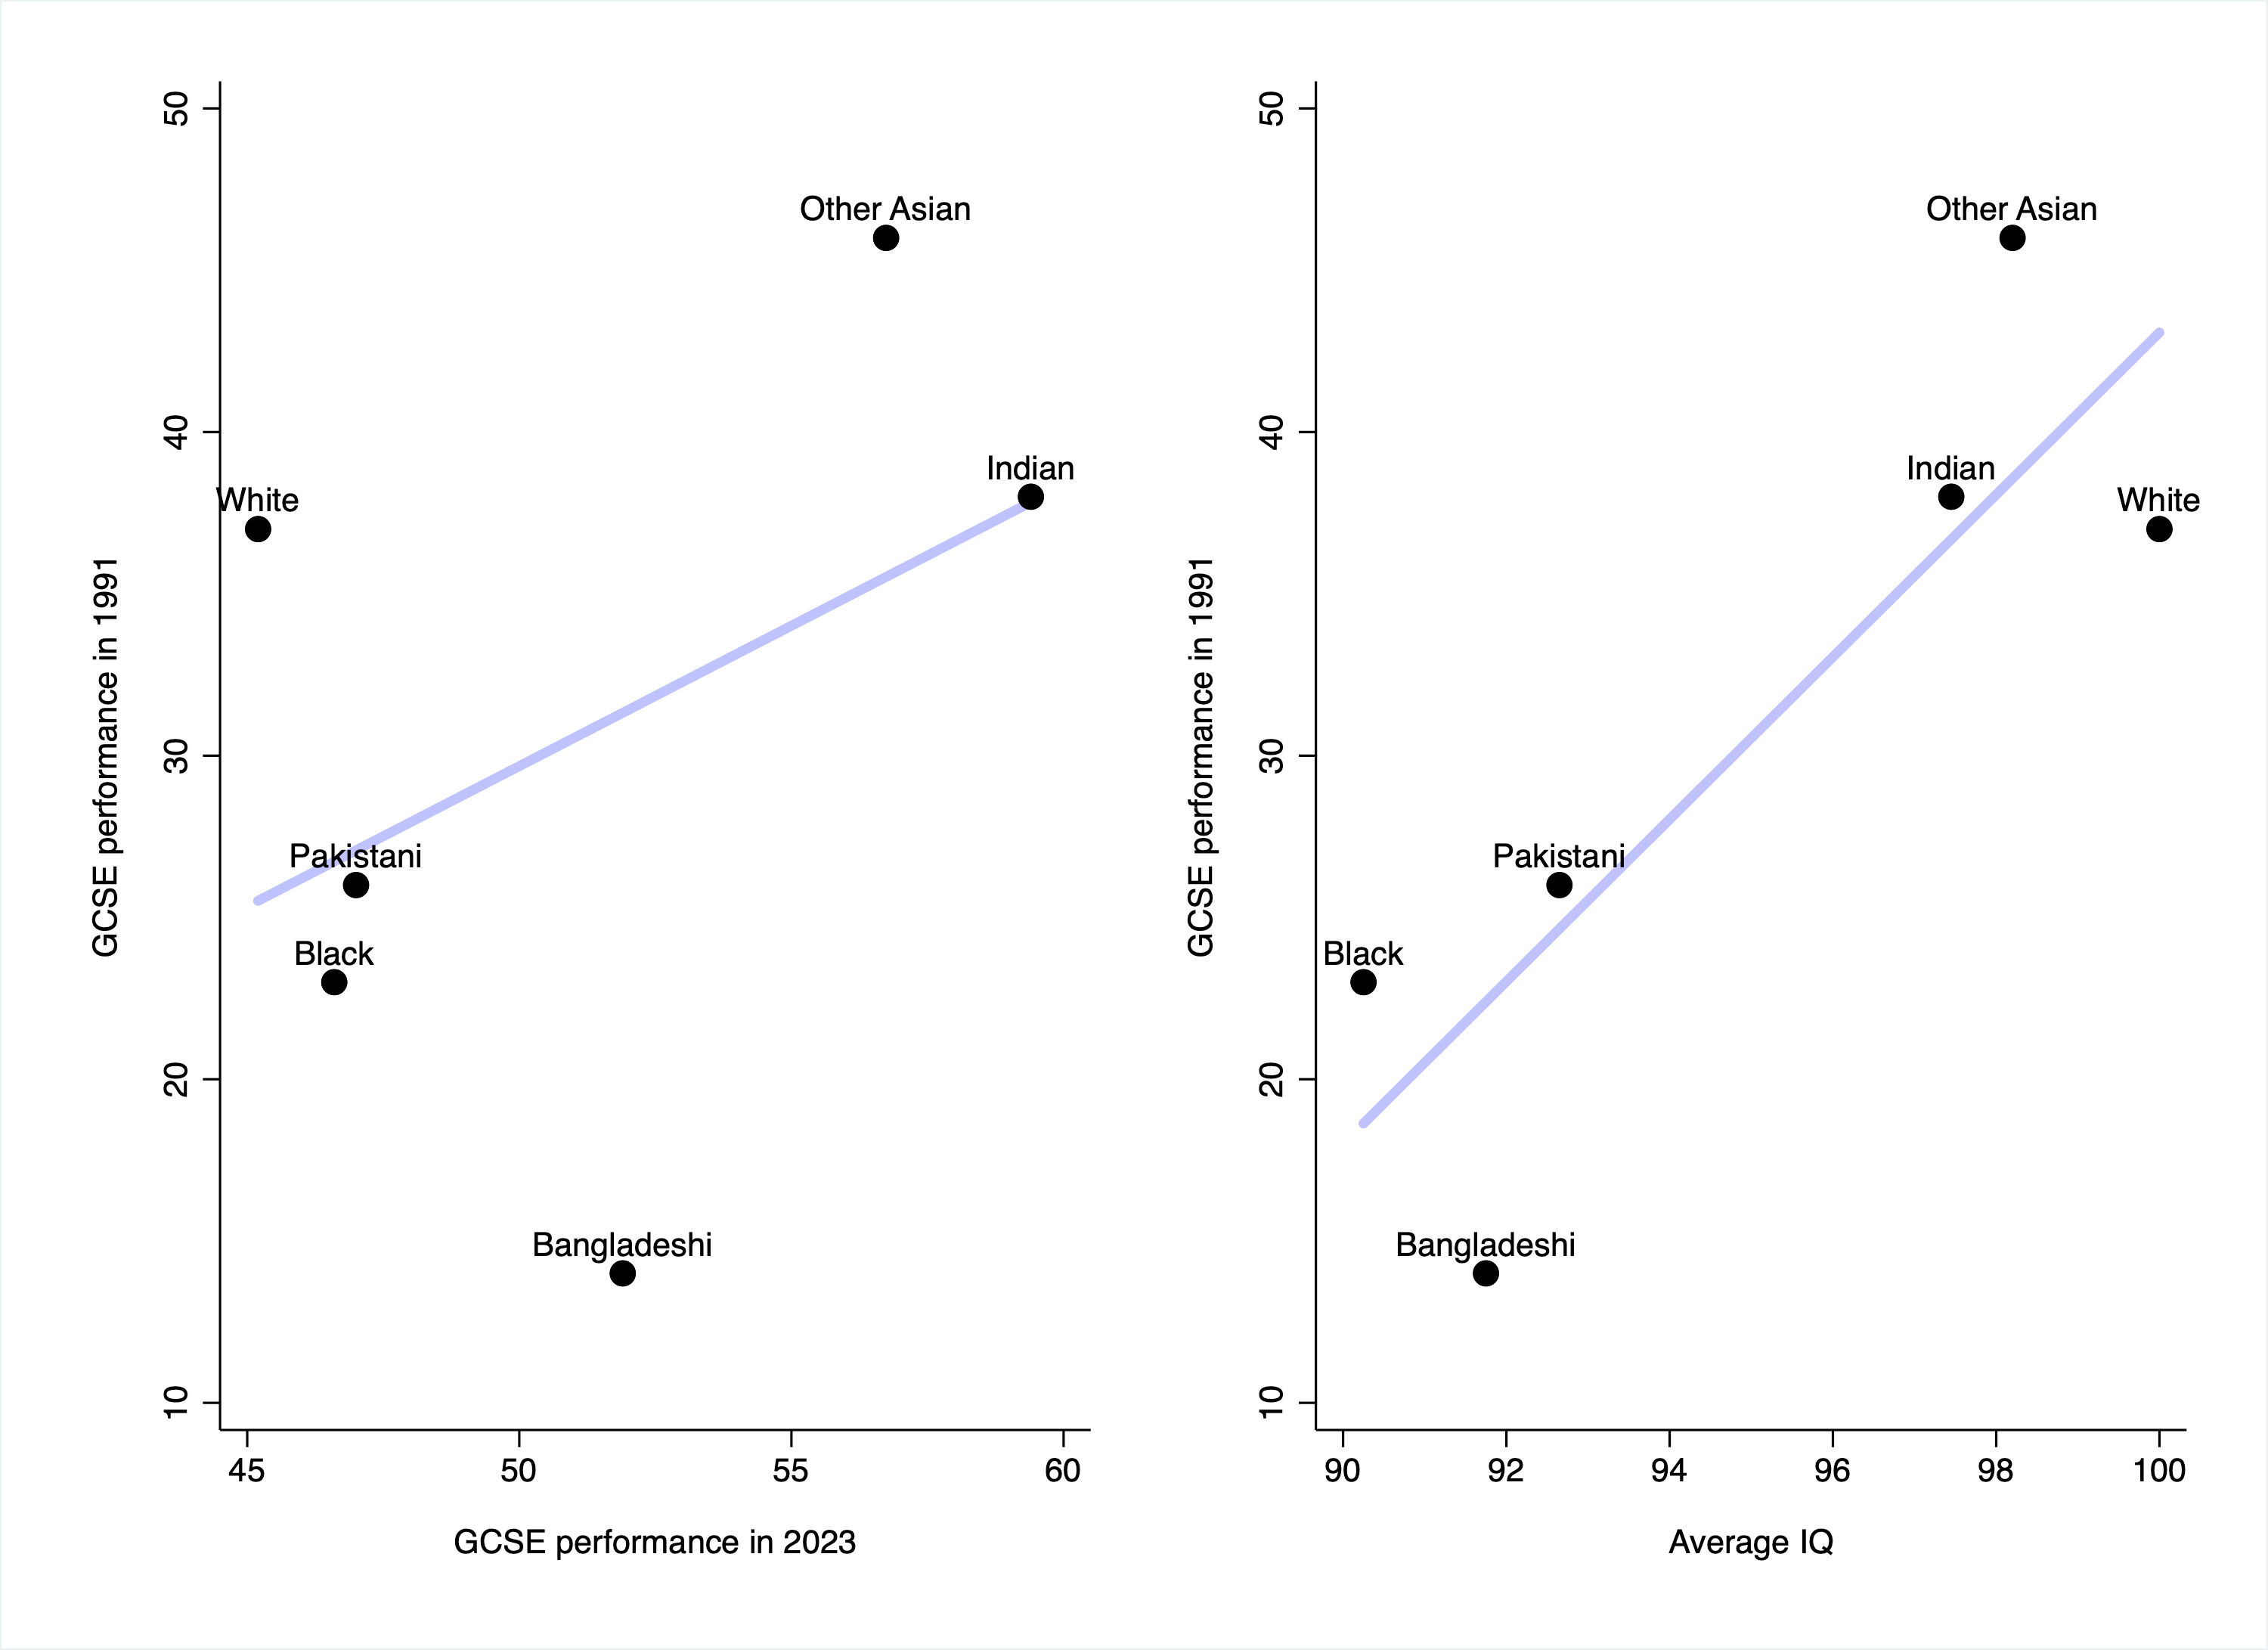
As you can see, the relationship is far stronger in the right-hand chart: GCSE performance in 1991 is better “predicted” by average IQ (r = .85) than by GCSE performance in 2023 (r = .44). This seems to imply that GCSEs were a better measure of intelligence (at least with respect to ethnic group differences) in 1991 than they were in 2023. Indeed, it is surprising how unstable the GCSE grade gaps are over time.4
Of course, GCSEs aren’t the only exams that teenagers in England and Wales take. There are also A-Levels, which are taken at ages 17–18. Unlike GCSEs, these aren’t compulsory: about 46% of pupils take them (and this percentage varies across ethnic groups).5 So for my next analysis, I looked at whether average IQ predicts A-Level performance better than it predicts GCSE performance. A-Level performance in 2023 was taken from here. Figures were available for 16 ethnic groups.6
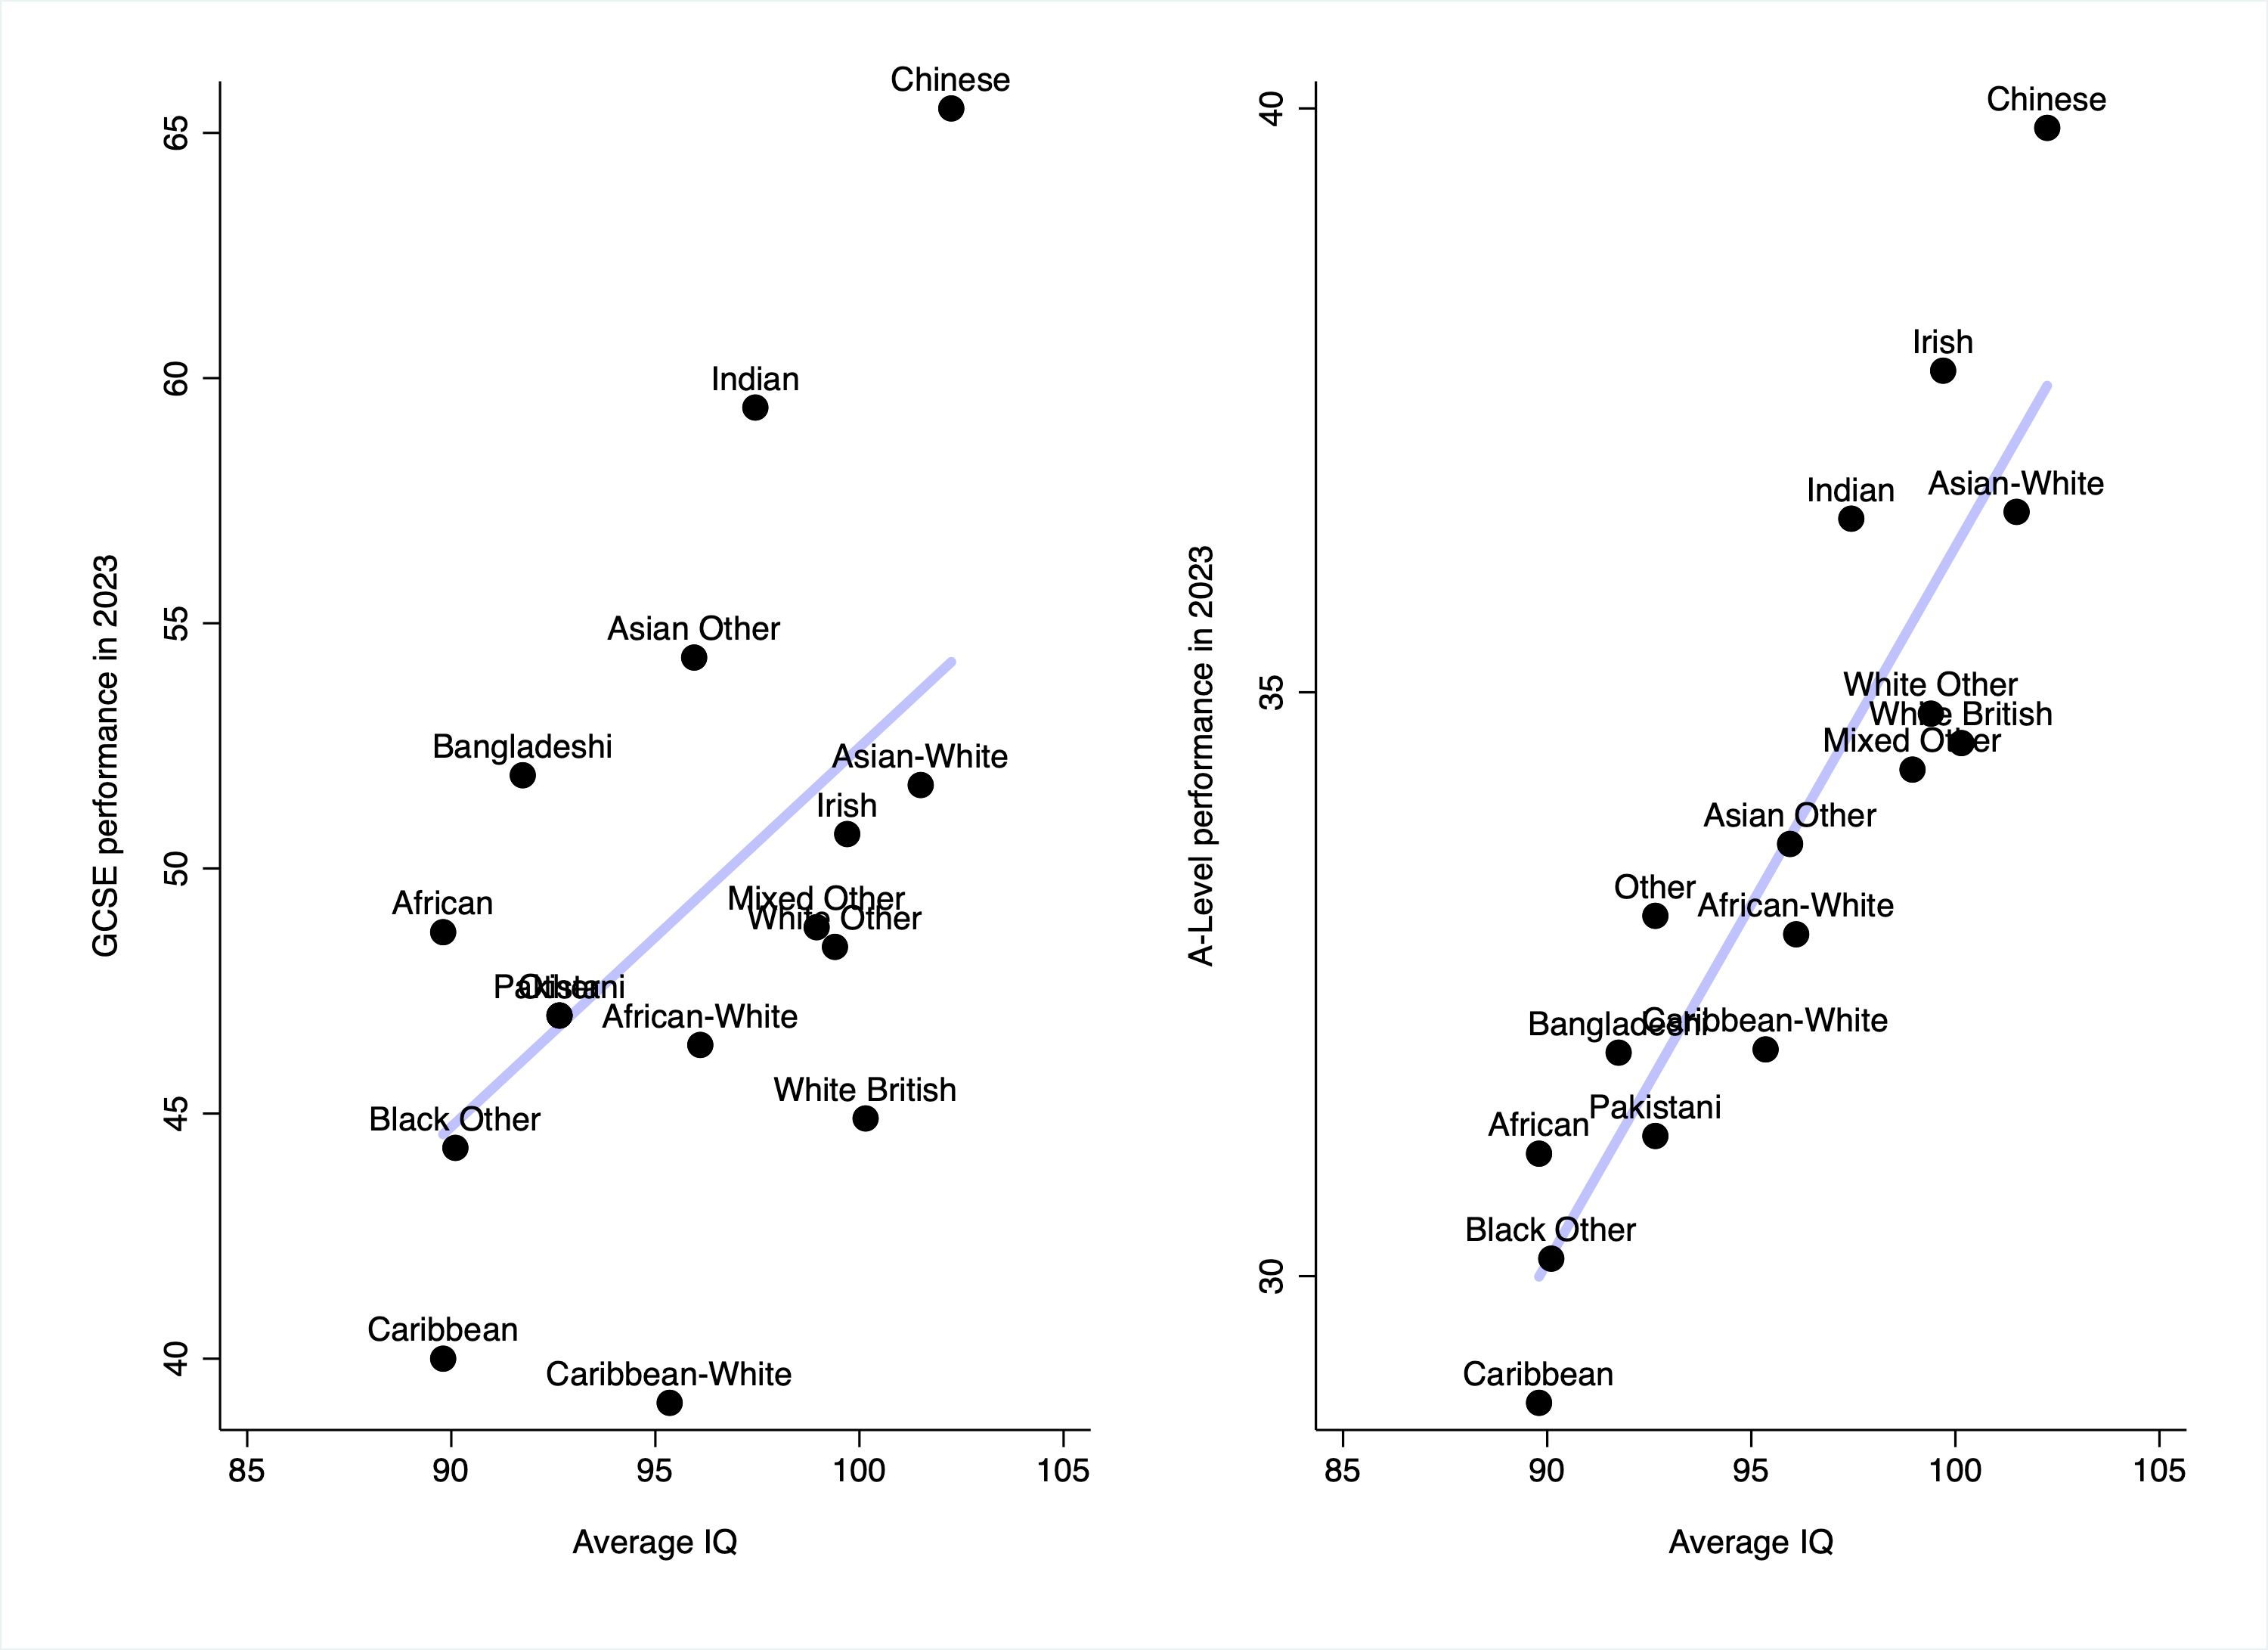
As you can see, the relationship is much stronger in the right-hand chart: average IQ predicts A-Level performance extremely well (r = .90), despite not predicting GCSE performance particularly well (r = .50). Its relationship with A-Level performance is almost perfect. Part of the reason is that White British pupils do considerably better at A-Level than they do at GCSE, relative to ethnic minorities.
Could this be due to differential selection into A-Levels? In other words, could it be because higher proportions of ethnic minorities select into A-Levels, meaning the marginal pupil is from a lower percentile of their group’s bell curve? This may be a small part of it, but the Black–White difference in A-level enrolment rates is simply not that big: 48% of Black pupils took A-Levels in 2023, compared to 40% of White pupils.7 And Chinese pupils, who come top, have the highest enrolment rate.
Could it be due to subject choice? In other words, could it be because higher proportions of ethnic minorities choose to study STEM subjects, which tend to be harder? Almost certainly not. Choosing to study STEM subjects doesn’t vary that much by ethnicity, and Indians, who do well, are among the most likely to pursue STEM. Plus, average grades in STEM subjects aren’t substantially lower than average grades in non-STEM subjects.
Another way to compare average IQs and GCSE performance is to look at which is a better predictor of average SES. So that’s what I did next. As a measure of SES, I used the share of households in the top fifth of incomes after housing costs. Unlike measures based on employment or occupation, this is not confounded by decisions about whether the wife works.
In some wealthy households, the wife doesn’t work because the husband earns enough to support the family on his own. This appears to be more common among Chinese than among Whites, for example. And in some poorer households, the wife doesn’t work because of cultural norms against women working. This appears to be common among Muslims. Hence measures based on employment and occupation may understate the SES of Chinese and overstate the SES of Pakistanis and Bangladeshis. Figures were available for ten ethnic groups.
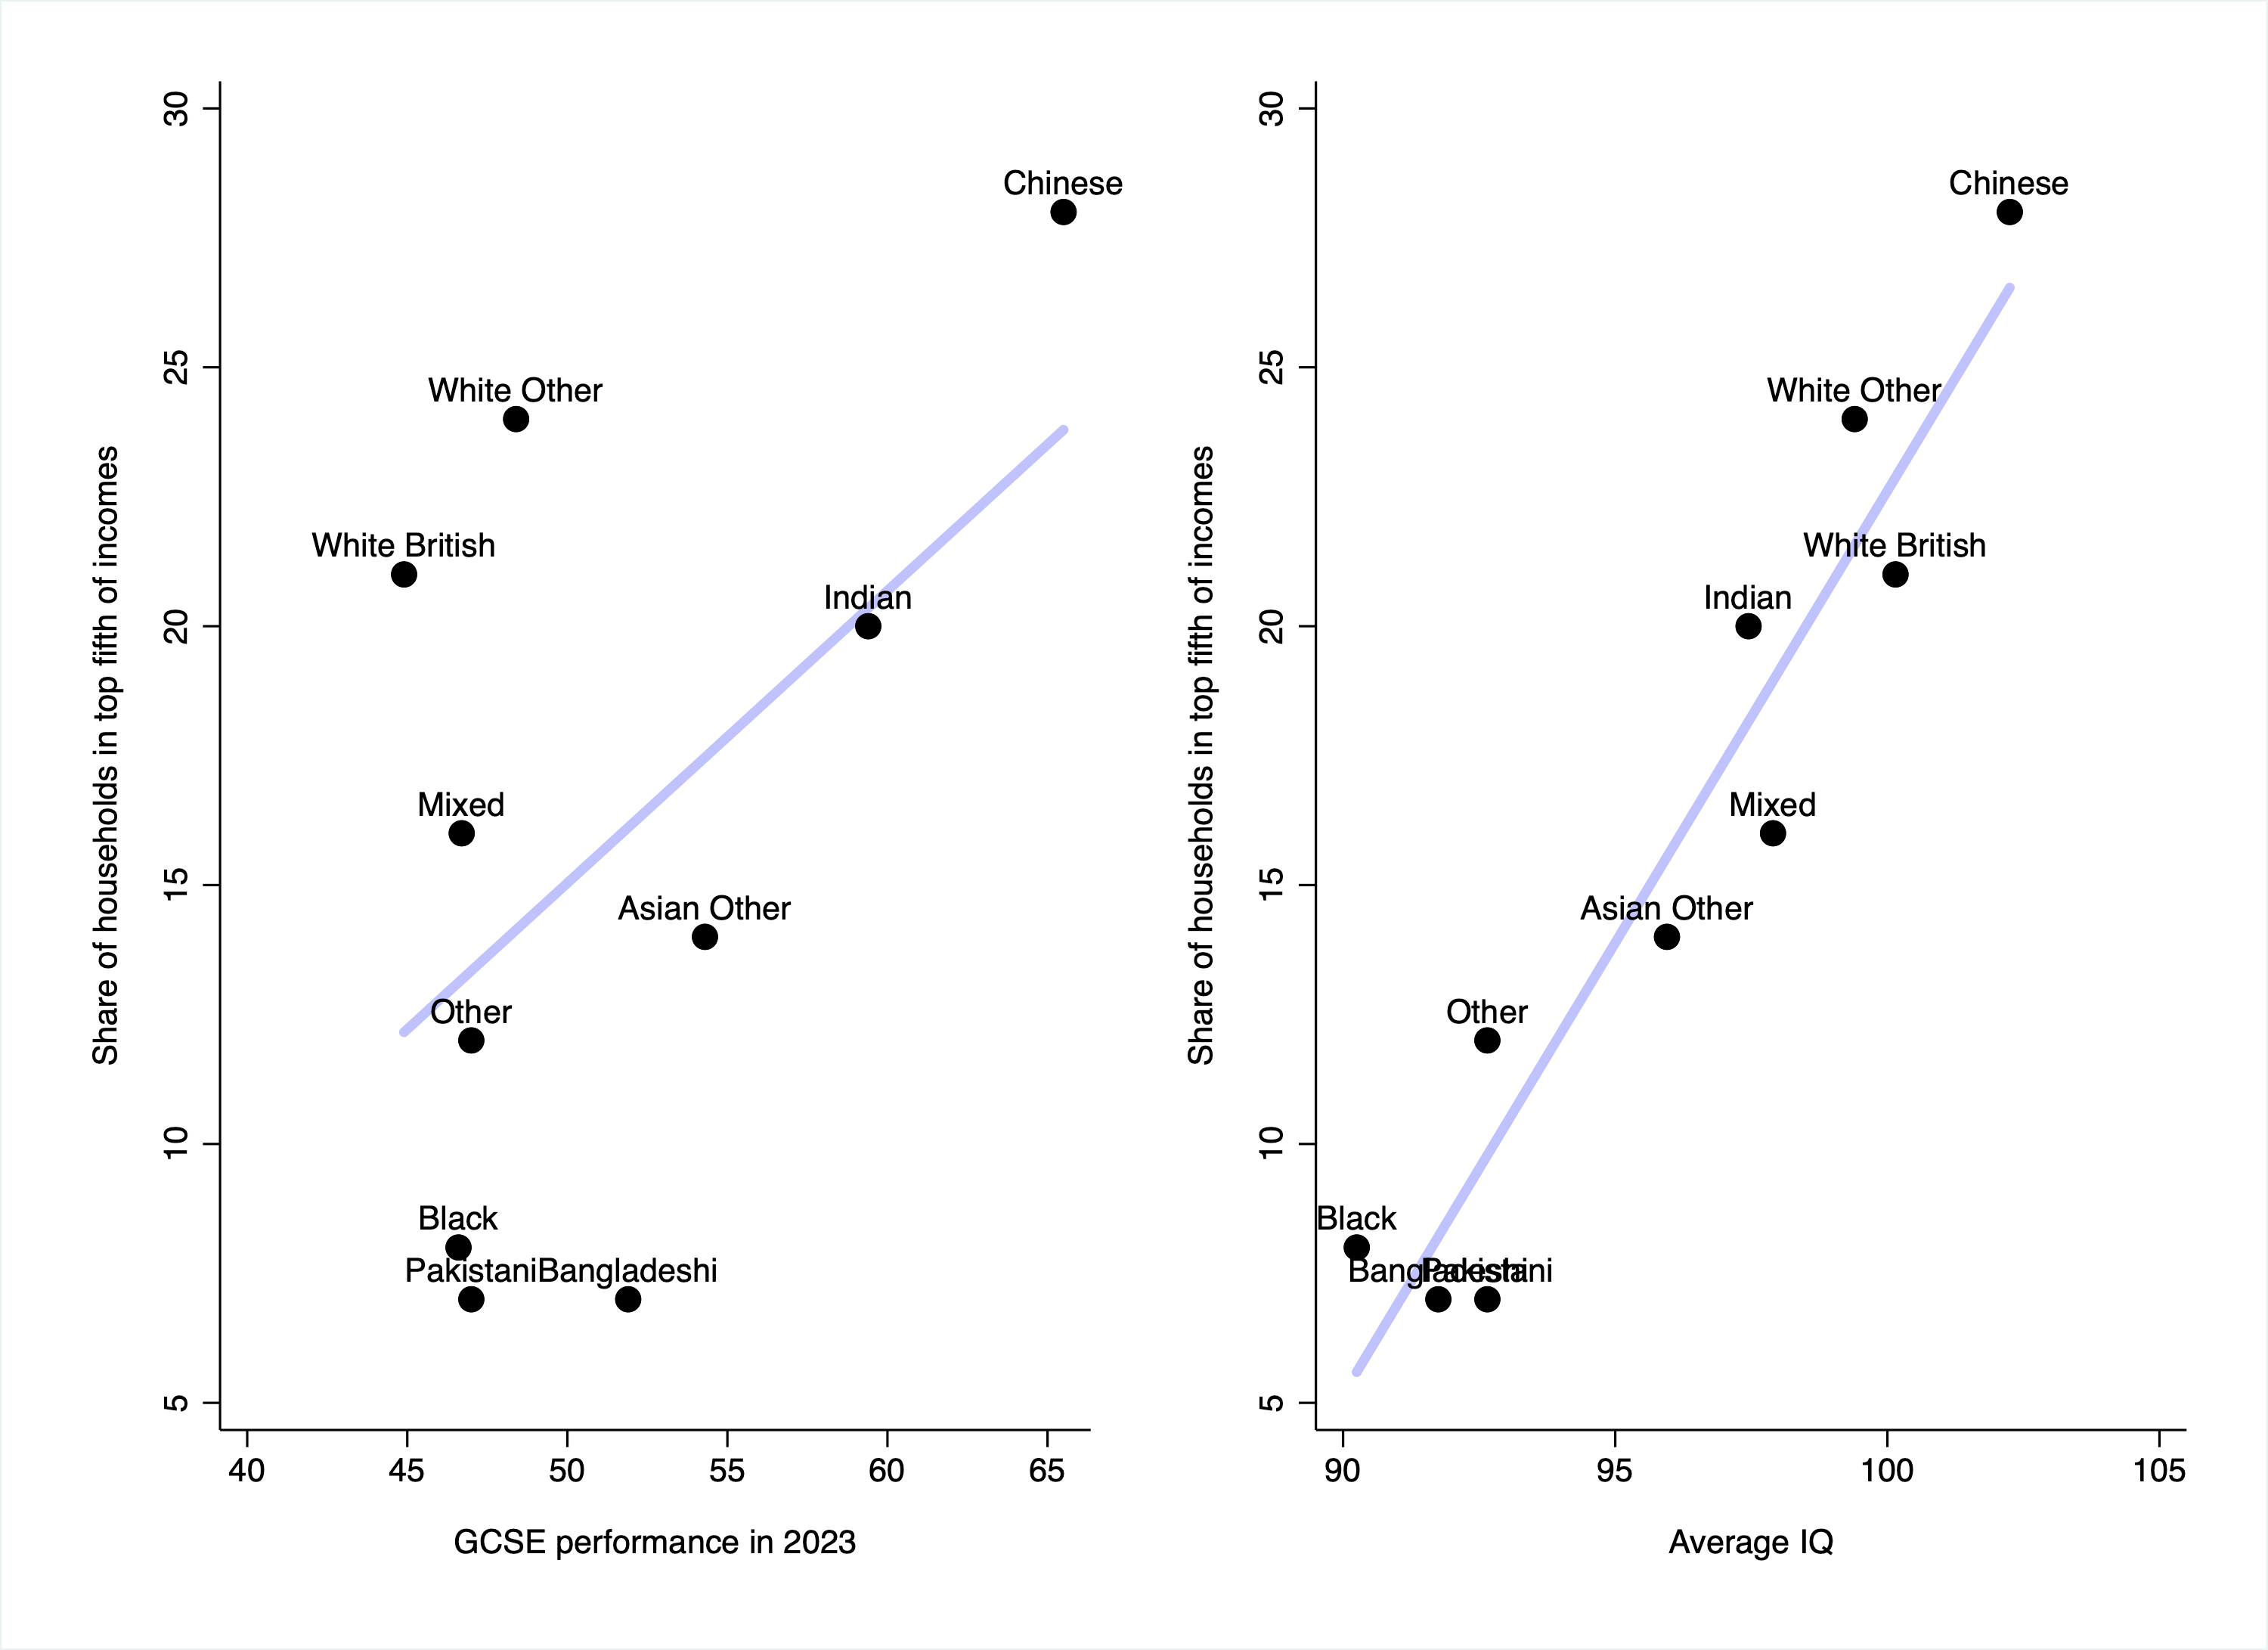
As you can see, the relationship is much stronger in the right-hand chart: average IQ is a far better predictor of average SES (r = .95) than is GCSE performance (r = .51). Once again, the relationship between average IQ and SES is almost perfect. By contrast, Pakistanis, Bangladeshis and Blacks have much lower SES than their GCSE performance would predict, while for Whites it’s just the opposite.
How can we explain all these findings? I will begin by attempting to steelman the case for environmentalism, before outlining an alternative hereditarian theory. The facts to be explained are that average IQ is very strongly correlated with GCSE performance in 1991, A-Level performance in 2023 and average SES, but is much less strongly correlated with GCSE performance in 2023.
I think an environmentalist would have to argue the following. The average IQ scores are out of date. Many of the samples on which they are based were adult samples, and some of the youth samples are from as far back as 2000. Over the last two decades, average IQs among Pakistanis, Bangladeshis and Blacks have increased, and are now about the same as that among White British people. Average IQ only predicts SES so strongly because SES is a lagging indicator, which reflects average IQs in the parents’ and grandparents’ generations. As for its strong correlation with A-Level performance, this is down to some combination of differential selection and racial bias at sixth form.8
The problem is this isn’t very plausible. To begin with, Lynn and Fuerst looked specifically at IQ among adolescents, using only data from 2006 onwards, and still found sizeable gaps on three different tests of cognitive ability. For example, the Black–White gap ranged from 7 to 9 points.9 Furthermore, differential selection is unlikely to explain average IQ’s strong correlation with A-Level performance for the reasons given above. And positing racial bias raises the obvious question of why such bias would suddenly arise at sixth form.10
An alternative hereditarian theory goes as follows. The ethnic IQ gaps are largely explained by genetic differences and therefore haven’t changed much over the last few decades. (Remember that we are talking about data from the 21st century, not the 1960s.) This is why average IQ strongly predicts GCSE performance in 1991, A-Level performance in 2023 and average SES. So what about GCSE performance since the late 2000s?
The first thing to note is that relatively poor White performance on school exams is not specific to GCSEs. It seems to arise first at SAT (taken at age 11) and then become more pronounced at GCSE. This means that, since the 1990s, something changed that led to White British pupils performing relatively worse on school exams and ethnic minorities performing relatively better.
One plausible candidate is the “London effect”. This is the name given to the fact that, since the early 2000s, London schools have improved dramatically relative to schools in other parts of the country. Back in 2002, Inner London was the worst-performing of any region. By 2012, it was the second best (with Outer London being first). Schools in London get way more funding for reasons that aren’t entirely clear.
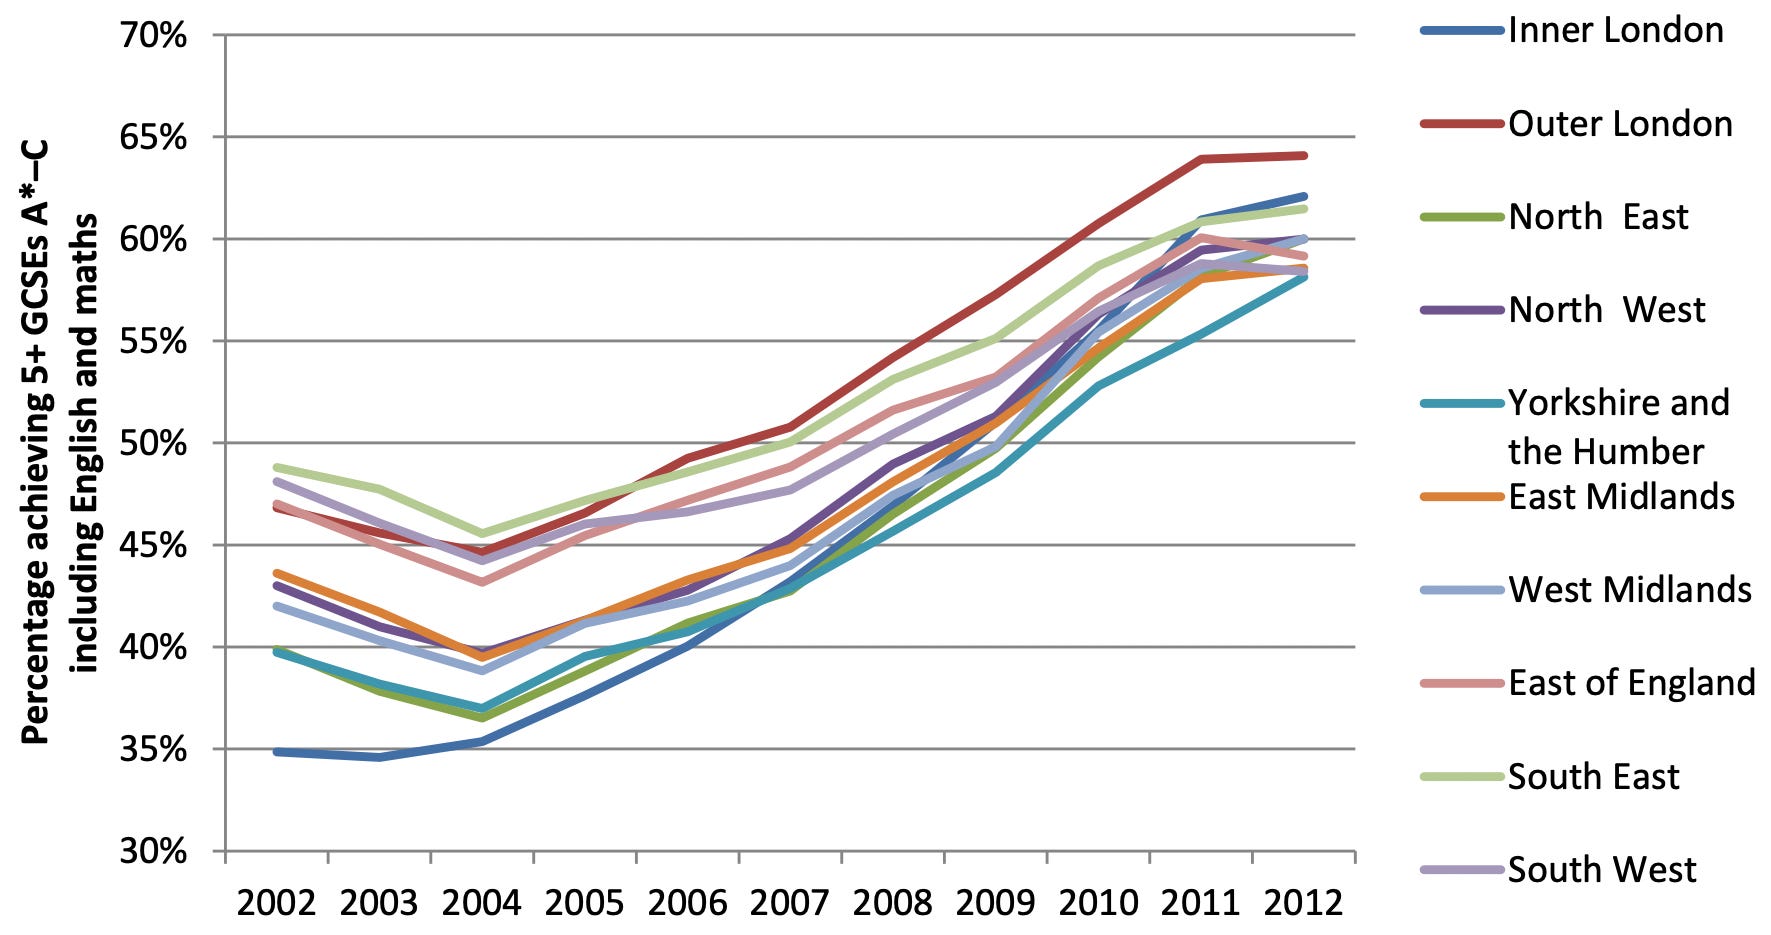
What is the most salient thing about London, demographically? It is very non-White. Ethnic minorities make up a majority of the population under 50, and an even larger share of the school-age population. As of the 2021 census, half of Bangladeshis in England, 49% of Blacks and 35% of Indians reside in the capital. And these three groups are the ones that have seen the greatest relative improvement in their GCSE performance since 1991.
However, the London effect is clearly only part of the explanation: ethnic minorities perform better than White British pupils in every region of England.11 Something more general must be going on.
I don’t think it’s only an “immigrant striver” effect, although this may help to explain why Black Africans outperform Black Caribbeans. About 71% of Bangladeshi pupils have a first language other than English and are thus presumably more recent arrivals. Yet they don’t perform any better than those who have English as a first language. Nor is the effect concentrated in areas with few White British pupils. Across local authorities, there’s no relationship between Bangladeshi attainment and the Bangladeshi share of pupils.12
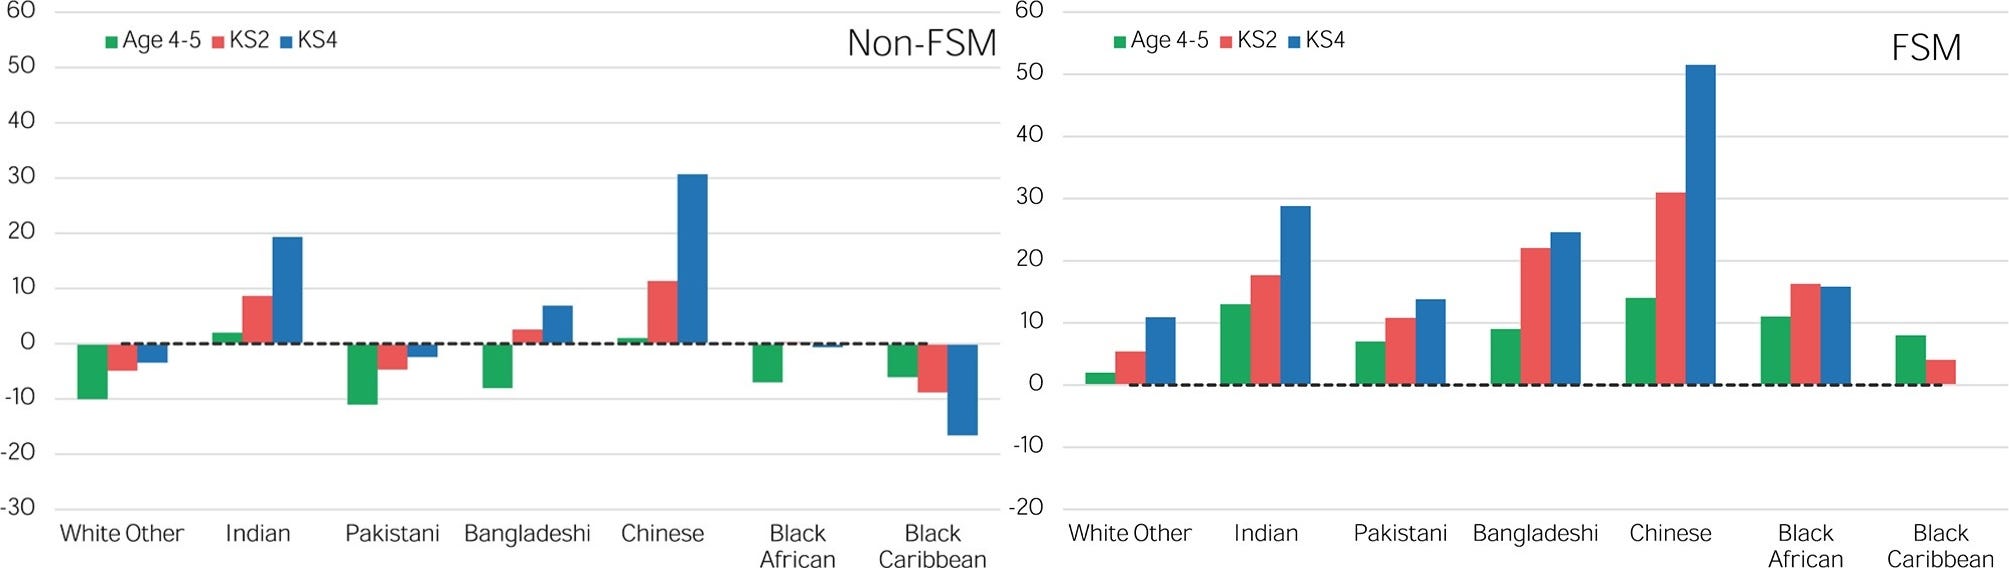
What we can say is that the effect is concentrated at the low end of SES.13 Among pupils who are not eligible for free school meals, Pakistanis, Bangladeshis and Blacks do roughly the same as White British pupils. Yet among those who are eligible, they do substantially better. For example, Pakistanis score marginally lower than White British pupils in the former category but more than 10 points higher in the latter. (Although there may be some selection into eligibility, the Pakistani–White difference is small. And as with A-Levels, the best-performing groups are the most selected.)
Here’s my best guess as to what’s going on. The very first chart in this article reveals that the GCSEs have become substantially easier over time: all groups have improved massively in absolute terms, including White British. The exams have therefore presumably become more “trainable”, more “gameable”. No one would seriously claim that the increase in average grades reflects a real increase in intelligence. Rather, it likely reflects some combination of easier questions, more “teaching to the test” and perhaps an increase in non-IQ skills (e.g., conscientiousness).
Now we have to explain why the massive improvement was relatively greater for minorities. One reason is that there was a concerted effort on the part of the authorities to reduce ethnic achievement gaps. It began in the late 1990s, with the introduction of the Ethnic Minority Achievement Grant, and was boosted in 2003 with the publication of ‘Aiming High: Raising the Achievement of Minority Ethnic Pupils’. Other relevant initiatives include the Black Pupils Achievement Programme, launched in 2005, and the Minority Ethnic Achievement Programme (focussing on non-Black groups).
Another possible reason is religion. The steady decline in religiosity in England is heavily concentrated among Whites.14 And according to a recent study, pupils who identify with a religion perform significantly better at GCSE than those who do not (when controlling for ethnicity and other background factors). This is consistent with several studies from the US, and holds for Christianity, Islam and “Other beliefs”. The exact mechanism by which religiosity raises school achievement is unclear; it may have to do with educational aspirations and/or community support.
As to why the effect is concentrated at the low end of SES, this likely reflects the authorities’ general lack of interest in problems facing the White working class and the White underclass, with the grooming gang cover-ups being a case in point.15 It is only since Brexit, and only really in the last five years, that lower-class Whites have been getting renewed attention.
Note that disparities between GCSE performance and average IQ are by no means unprecedented. As Cremieux points out, girls have long outperformed boys at GCSE, despite having no advantage in intelligence. (Some evidence suggests that boys have a small advantage by age 16.) The reason for girls’ higher grades is that they are more diligent and less easily distracted in school.
Nearly all ethnic minorities outperform White British pupils at GCSE. However, extensive data indicates that several of these groups have lower average IQs—to the tune of 7–10 points. Furthermore, average IQ is very strongly correlated with GCSE performance in 1991, A-Level performance in 2023 and average SES. So why have White British pupils been doing relatively worse since the late 1990s? It may be a consequence of deliberate efforts to close ethnic achievement gaps and declining religiosity, along with a disregard for the fortunes of lower-class Whites.
Noah Carl is an Editor of Aporia.
Become a free or paid subscriber:

Like and comment below.
“Attainment 8” is a pupil’s weighted average grade across eight subjects, including English and maths.
The terminology here is confusing. In Britain, independent or private schools are those that do not receive state-funding. However, a subset of these schools are known as “public schools”. (These are the most elite private schools—places like Eton and Harrow.) The reason they are termed “public schools” is that, historically, most schooling in Britain was local or parish-based, but they were open to boys from anywhere in the country (whose families could afford to pay).
At this time, most of the pupils in “Other Asian” were East Asians (mostly Chinese). “Chinese” subsequently became its own category, at which point the average for “Other Asian” declined in relative terms.
Confusingly, private school pupils are included in the 1991 figures, which were sourced from a cohort study with a nationally representative sample. However, this almost certainly can’t account for more than a small part of the difference from the 2023 figures. Fuerst and Lynn examined the ethnic gaps from 2001 to 2018, and there is no discontinuity when switching from figures that include private school pupils to figures that exclude them (those from 2007 onwards exclude private school pupils).
“Gypsy or Roma” and “Irish Traveller” were excluded as there were only 73 and 30 A-Level students in each group, respectively (compared to at least 900 in all the other groups).
Sixth form refers to the final two years of secondary school in England and Wales, during which pupils take A-levels. It is not compulsory.
The gap was less than 4 points on the National Reference Test. Yet as Lynn and Fuerst note, “Since the NRT is designed to measure changes in GCSE math and reading qualification difficulty, this is as expected.”
Large increases in average IQs among ethnic minorities would predict narrowing of ethnic pay gaps. And while there has been a reversal of the Asian-White gap, there has been no narrowing of the Black–White gap. However, pay gaps aren’t the best measure since they ignore differential selection into the labour market.
Whites perform well in London, but this is because they are heavily selected. Poorer and working-class Whites have been moving out of London for decades.
This may help to explain why average IQ is so much more correlated with A-Level performance: only about half of pupils go on to do A-Levels and they are disproportionately drawn from the high end of SES.
44% of White Brits said they had no religion in the 2021 census, compared to only 15% in the 2001 census, a decline of 29 percentage points. For Bangladeshis, the decline was only 1 percentage point.
Nice analysis. Seem the British decided to tune all the parameters in the system to achieve a semblance of equality of outcomes.
There is a bell curve in each ethnic group so there will be some blacks that perform better than some Chinese or whites. We have to refocus on the individual and ignore the ethnic group from which that individual comes. It was the proponents of bean counting by race or ethnicity that created this problem. As Cofnas has pointed out, under any regime there will be black professors at Harvard, just fewer of them. Using Harvard’s own research. It’s really only in academia that people care about it.