


Written by Aaron Dymarskiy.
Various studies have reported that, after about age 20, scores on some IQ subtests decline, while scores on other subtests rise or stay the same, not declining until much later. Subtests that decline after age 20 are typically measures of fluid intelligence—the ability to solve problems without the application of outside information. Meanwhile, those subtests that rise or stay the same are generally measures of crystalized intelligence—the ability to solve problems that require some kind of outside information. Here are some pertinent quotes from the literature:
For each variable there is an increase until about the late teens or early 20s, followed either by a decrease for the process variables, or by a period of stability and then a decline at around age 50 or 60 for product variables. (Salthouse, 2010, p. 27)
Scores for fluid intelligence (e.g., short-term memory) peak early in adulthood, whereas measures of crystalized intelligence (e.g., vocabulary) peak in middle age. (Hartshorne & Germine, 2015, p. 433)
The growth of gf is steady but relatively rapid and reaches a maximum in the late teens or early twenties, after which it shows a gradual decline … Scores highly loaded in gc on the other hand, show a more gradual increase from infancy to maturity, and … decline does not set in until relatively late in life, usually not until about 60 to 70 years of age. (Jensen, 1980, p. 235).
The truth, however, is that intelligence actually rises into at least middle adulthood (ages 45–60), regardless of whether it is measured as fluid or crystalized intelligence.
Issues with cross-sectional studies
All of the research summaries cited above relied entirely on cross-sectional studies for their conclusions. IQ was assessed at the same time for people of different ages, and the age-related pattern was examined. The problem with this approach is that age at a given time is perfectly correlated with year of birth, which itself is negatively correlated with IQ in samples of the same age measured at different times. This is known as the Flynn effect.
The bias resulting from the Flynn effect in cross-sectional research can be illustrated using the graph below (Raven, 2008):
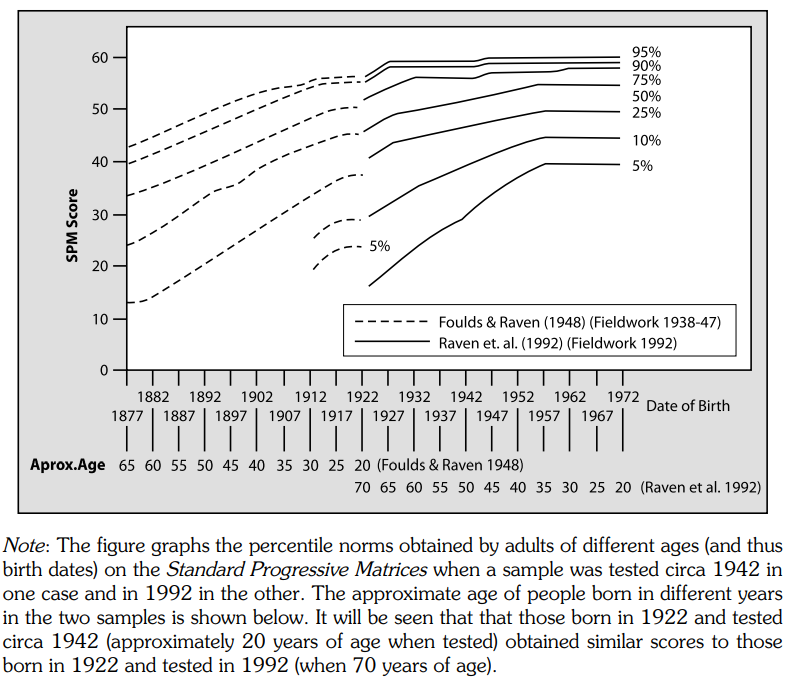
It shows the results of two standardization samples, one from “circa 1942,” and the other from 1992, for the Standard Progressive Matrices (SPM). Those born in 1887, and therefore aged 65 at the time of testing in 1942, had a median score of about 24. By contrast, those born in 1927 and therefore aged 65 at the time of testing in 1992, had a median score of about 48! If the youngest participants included in this figure are examined (twenty-year-olds born in either 1922 or 1972) the difference in median scores is about 8 points, or one standard deviation.1
Furthermore, comparing those of the same birth year shows surprisingly little change over time. As the note says, those born in 1922 obtained approximately the same score at age 20 when tested in the first study as participants in the second study who were also born in 1922 but were then aged 70. The difference is less than one point. This means that, when year of birth is the same, a seventy-year-old performs just as well on this test as a twenty-year-old, despite the fact that the SPM is considered to be an almost pure measure of fluid intelligence.
Merrill Hiscock (2007), using essentially the same data as presented above, calculated that the Flynn effect caused an increase of 0.36 points a year on the SPM, while the cross-sectional difference by age is 0.51 points per year. This means that 71% of the age difference between the oldest and youngest group (25 and 65 year-olds) can be explained by bias due to the Flynn effect. Hiscock’s estimate suggests that the real decline between age 25 and age 65 is only about 6 points, rather than 20 before the adjustment—so less than one standard deviation, rather than about 2.5 SDs.2
Later, Dickinson & Hiscock (2010) attempted to recreate this analysis with the WAIS tests. They did this for the normalization samples of three editions of the test—the WAIS-R, WAIS-III and WAIS-IV.
They found that, in the WAIS-R, the 70-year-old sample had an IQ only 2.5 points lower than the 20-year-old sample after the adjustment, compared to 16.5 points without adjustment. The same difference of 2.5 points was found for the WAIS-III. And in the WAIS-IV, the adjusted difference was zero.
When verbal subtests (which are more indicative of crystalized intelligence) and performance subtests (which are more indicative of fluid intelligence) are separated, an interesting pattern emerges. In the WAIS-R, verbal scores increased by 7 points between ages 20 and 70, while performance scores decreased by 13.5 points (after adjusting for the Flynn effect). Numbers for the two other normalisation samples were similar. This suggests that crystalized intelligence increases very slowly between ages 20 and 70, while fluid intelligence decreases very slowly. These conclusions are very different from those that have been drawn from cross-sectional data‚—that crystalized IQ doesn’t change between about ages 20 and 50–60 and then declines, and that fluid IQ decreases by 22–30 points, “from the 20s to the 70s” (Salthouse, 2010, p. 17).
While the preceding studies tell us quite a bit, they do not tell us when cognitive ability begins to decline. In addition, they suffer from some methodological problems, such as the likely false assumption that the Flynn effect had the same magnitude in the latter half of each period as in the former half. Luckily, there is another type of study that allows us to be more precise, while not requiring estimation of the Flynn effect.
Longitudinal studies
These are studies in which the same individuals are tested multiple times on the same test—to estimate how IQ changes over the life course. The largest such effort has been made by K. Warner Schaie.
His famous Seattle Longitudinal Study comprises thousands of participants, some of whom have been tested with the Thurstone Primary Mental Abilities test multiple times since 1956, with a new cohort of participants added every seven years. In total, six cohorts have been tested after 7 years, five have been tested after fourteen years, and so on. The original participants (i.e., members of the initial study who haven’t dropped out) have been tested 42 years apart. All of the findings are summarized in Schaie’s (2005) book on the topic. Here is what he has to say.
On 7 year follow ups:
One can observe immediately that statistically significant cumulative age decrements from any previous age do not occur for any variable prior to age 60. Several variables were found to have modest increments in young adulthood and middle age.
On 14 year follow ups:
When age changes are examined over 14-year segments, such change becomes statistically significant for Number as early as age 53, for Word Fluency at age 60, and for the remaining three abilities at age 67.
On 21 year follow ups:
Modest but significant decrements are noted for Number and Index of Intellectual Ability by age 60 and for remaining variables by age 67. Cumulative decrements estimated from the three samples that cover the entire age range from 25 to 88 years amount to 0.5 SD for Verbal Meaning, 0.7 SD for Spatial Orientation and Inductive Reasoning, 1.0 SD for Number, and 0.9 SD for Word Fluency.
On 28 year follow ups:
Significant decrements over the 28-year segments are first observed for Number and the Index of Intellectual Ability by age 60; for Inductive Reasoning, Word Fluency, and the Index of Educational Aptitude by age 67; and for Verbal Meaning and Spatial Orientation by age 74.
On 35 year follow ups:
In these data, significant decline is only observed for Number, Word Fluency, and the Index of Intellectual Ability only by age 67 and for the remaining variables by age 74.
And on 42 year follow ups:
Findings are quite similar to those for individuals followed for 28 years [though the sample size is only 37].
All of these results indicate that there is no cognitive decline until at least age 60. However, the decline after age 70 is very steep, so that by the late eighties IQ has declined by something like 10 points relative to age 25.
Although this is by far the biggest longitudinal study in terms of sample size and number of waves, it is not the only relevant one. The table below summarizes several other studies I was able to find, with change expressed in standard deviation units.3
Every study that includes a follow up before or at age 50 agrees that IQ rose up to that point. Meanwhile, studies that examine change in IQ after age 50 agree that it declines very slowly at first. For example, Owens (1966) found a tiny, statistically insignificant decline between ages 50 and 61. Mortensen & Kleven (1993) found a decline of a tenth of a standard deviation between age 50 and 60, and a fifth of one between 60 and 70. The two studies tracking decline after age 70 found it to be quite steep: a quarter of a standard deviation between 75 and 79, and a third of a standard deviation between 70 and 82.
All these findings suggest that by age 60, and perhaps even by age 70, the average person is more intelligent than they were at age 20—as IQ increases until age fifty but only begins to decline sharply after about age 60, and only very sharply after age 70. It should be noted that the two studies with the longest follow up periods found that IQ increased by a full standard deviation between ages 11 and 77!
What about fluid versus crystalized intelligence? The chart below from Salthouse (2010) shows the annual change by subtest in longitudinal studies, based on data from McArdle and colleagues (2002). Incidentally, I didn’t include this study in the table above because the number of follow up tests, and the length of time between each administration, differed for each participant.
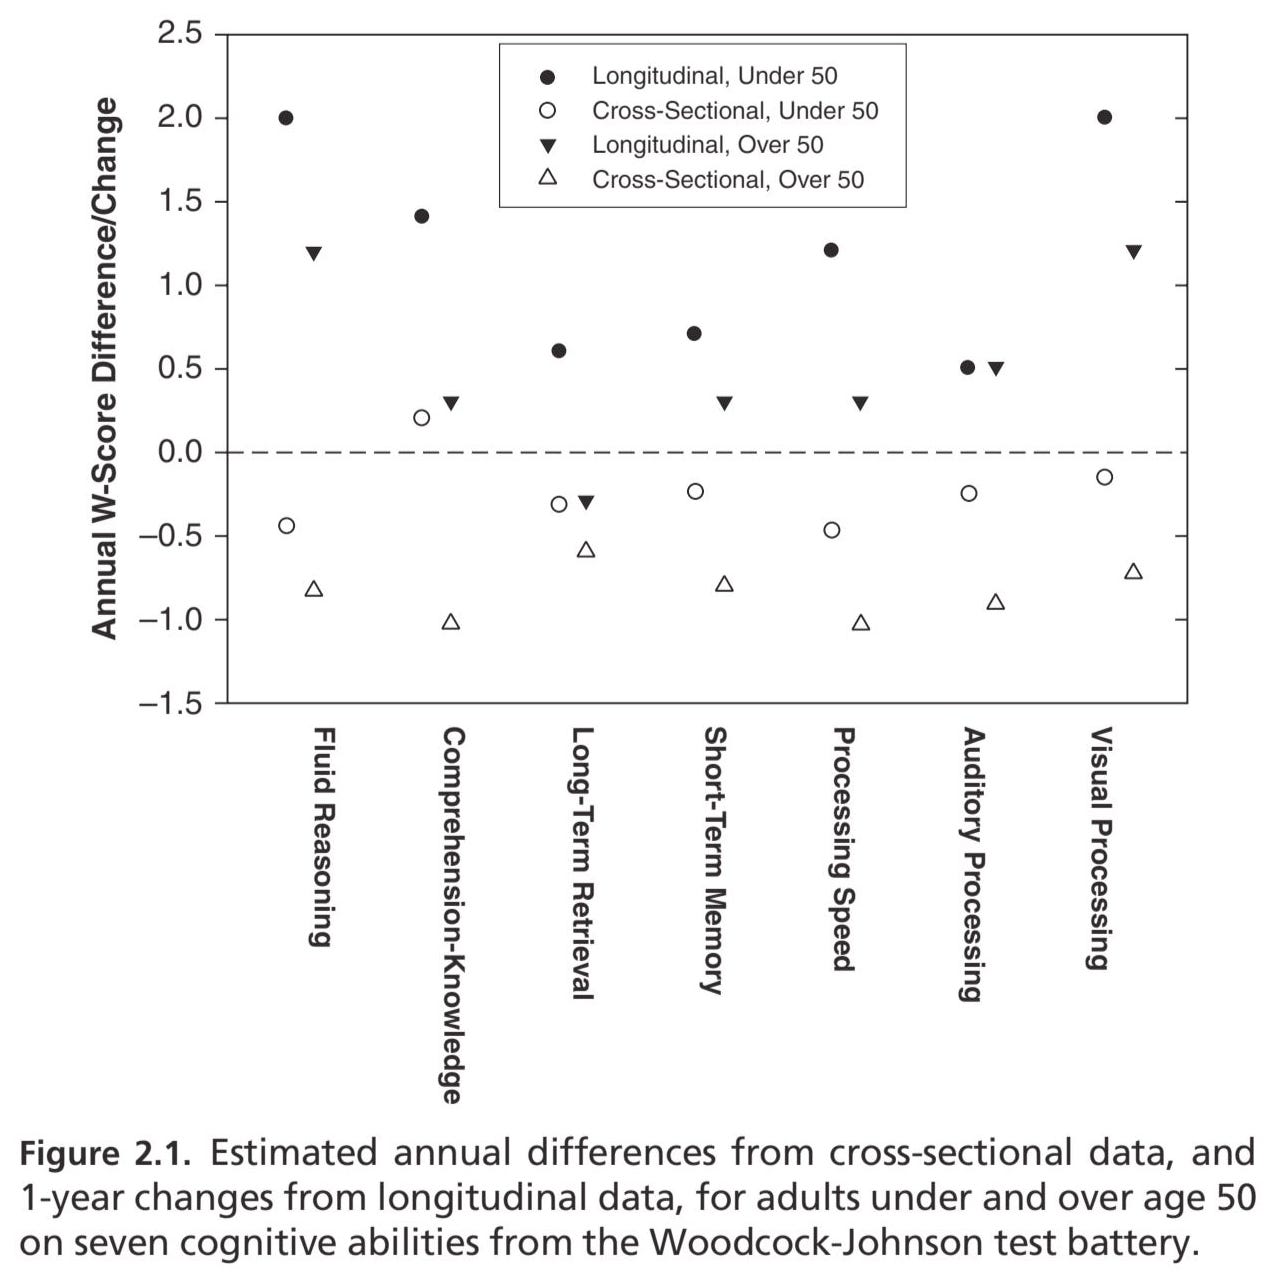
In the longitudinal data (the black circles and triangles), scores on all subtests increase with age for under 50s, and all but one (long-term retrieval) increase for over 50s. This means that scores on all types of intelligence, whether fluid or crystal, increase with age until at least 50, and, for the most part, even after 50—though it is unclear for how long.
In fact, the largest increase occurs in the fluid reasoning and visual processing subtests, which are measures of fluid intelligence. Similarly, the Seattle Longitudinal Study data reviewed earlier show essentially no decline on any subtest before age 60. A recent study by Tucker-Drob and colleagues (2022) found that declines in crystalized and fluid intelligence were highly correlated, suggesting that the two dimensions shouldn’t be contrasted in cognitive aging research.
To summarize, intelligence increases at least until 50, and IQ at age 70 is not much lower than it is at age 20, and perhaps even higher. Also, both crystalized and fluid intelligence show this pattern, contrary to the claim that fluid intelligence declines much earlier. Incidentally, the most likely reason this (erroneous) claim became widely accepted is the focus on cross-sectional studies. These are biased by the Flynn effect, which happens to be much stronger on tests of fluid intelligence (Pietschnig & Voracek, 2015).
(Non-)issues with longitudinal studies
Unfortunately, even longitudinal studies do not provide completely unbiased estimates. Their most commonly cited flaw is that participants take the same test multiple times, which biases scores upward at the follow up waves, due to practice effects (e.g., Salthouse, 2010, pp. 42–43). The issue of practice effects is challenging because, by definition, participants must be tested at least twice, and must be tested using the same test, or else comparison is essentially impossible.4
I am aware of only one study that included individuals from the same birth cohort who did not participate in initial testing but did in the follow up—to see if they scored worse than those who did participate initial testing. Specifically, Larsen and colleagues (2008) found no evidence for a practice effect: the two groups achieved the same average scores at the follow up. Unfortunately, however, the researchers were unable to rule out that the possibility that both groups were tested twice and some of the results simply got lost.
Another way to estimate bias due to practice effects is via a quasi-longitudinal design. This is where multiple cross-sectional studies are conducted, with a significant amount of time separating each one (e.g., five years). The data are then used to create an estimate of IQ at a given age independent of cohort.
Salthouse (2019) estimated longitudinal, cross-sectional, and quasi-longitudinal changes due to age in a large sample collected over a large span of time. Participants in the longitudinal studies differed in terms of the time between the initial and final testing, but this time was, on average, six years. The quasi longitudinal data was also based on individuals born in the same year tested six years apart. The findings are shown in the charts below:
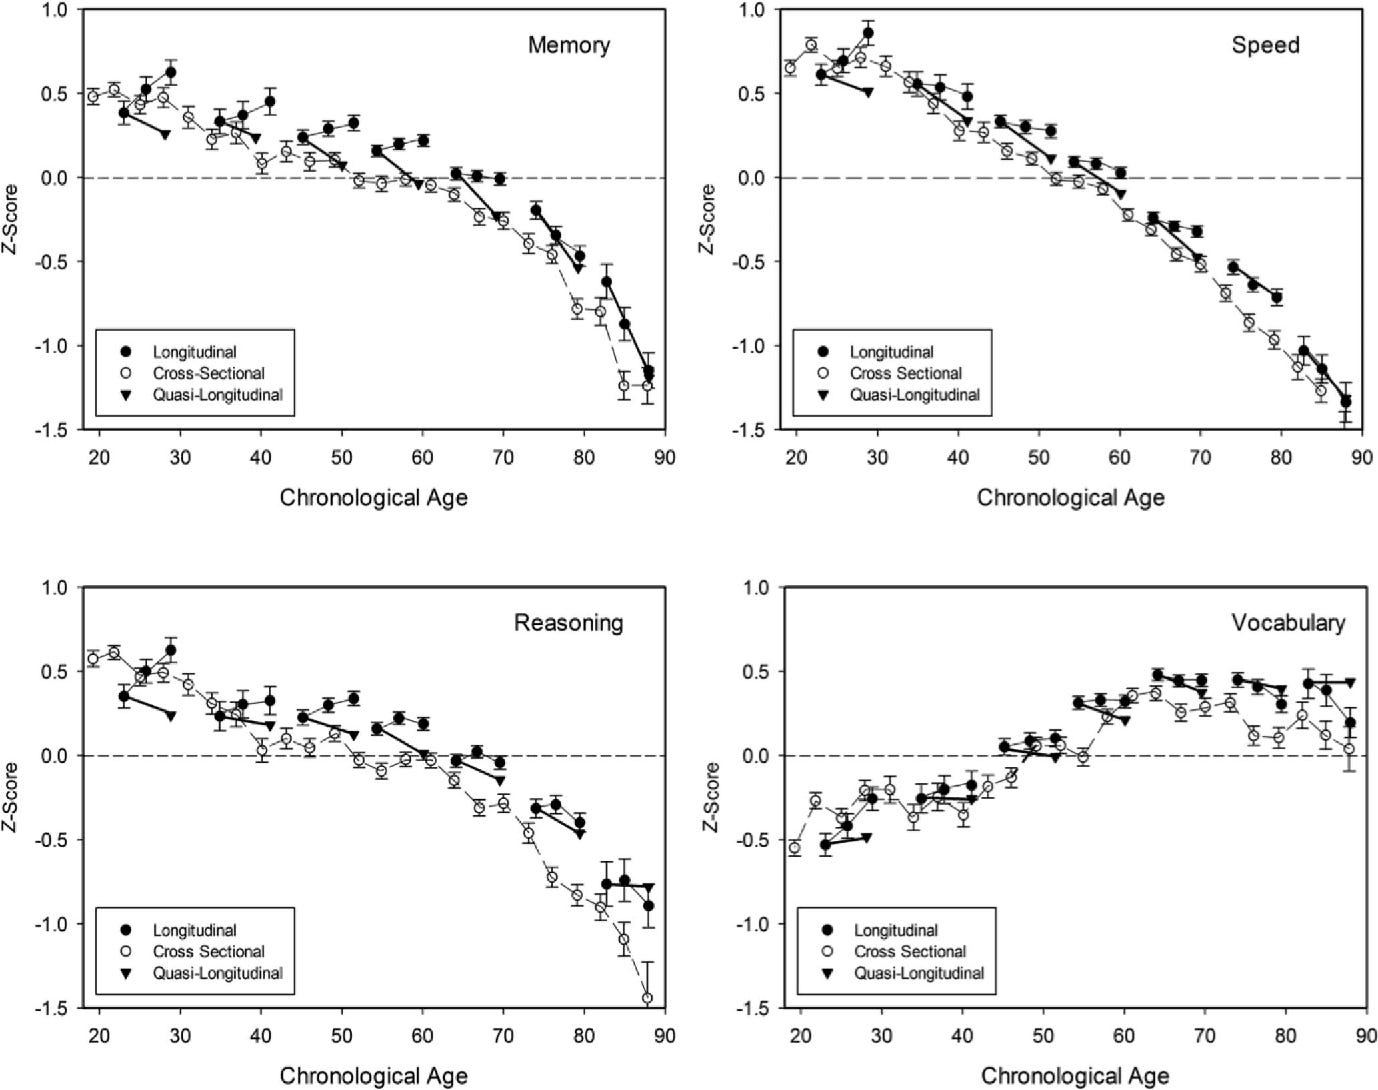
I will focus on Reasoning and Vocabulary, because these were measured using tests most similar to traditional IQ tests.5 It can be seen that, while the longitudinal data show an increase in both measures until the 60s, this is not the case for the quasi-longitudinal data, where Reasoning starts declining in the twenties and Vocabulary in the forties.
Salthouse’s data show a slow decrease in Reasoning ability until middle age, and then a faster decrease into late adulthood. The Vocabulary data show no statistically significant decline until the mid 60s. In terms of fluid and crystalized intelligence, this means a loss of one standard deviation of fluid IQ between young adulthood and old age and at most perhaps a fourth of a standard deviation in crystalized IQ. The decline in fluid IQ is similar to the estimated decline in the SPM (a little under 1 SD) or the WAIS tests (9.5 to 13.5 points). However, the slight loss, or perhaps no change, in crystalized IQ is very different from the WAIS data, which show a sizeable increase (4.5–8 points).
Finally, it is worth comparing the quasi-longitudinal data to the cross-sectional data. For Reasoning, the cross-sectional decline is twice as high in both younger adults and elderly adults. And the numbers are similar for Vocabulary.
Schaie (2005), in his Seattle Longitudinal Study, also used a quasi-longitudinal design to examine change in IQ. Like Salthouse, he tried to eliminate practice effects by comparing individuals born in the same year but tested at different ages. Recall that, in his study, a new cohort was introduced every seven years, yielding six different cross-sections over 42 years. However, unlike Salthouse, Schaie adjusted the longitudinal data for attrition. After this adjustment was made, none of the practice effects were significant “except for Verbal Meaning in Sample 1 from T₁ to T₂ and from T₆ to T₇” (p. 201). Therefore, practice effects were minimal.
Another way to check whether or not the practice effect made a difference is to see if results from different waves pass a test of measurement invariance.6 This is because practice effects are perfectly negatively correlated with g-loadings (Nijenhuis et al., 2007).
After examining measurement invariance in his own data, Schaie (2005)’s concluded that “invariance within groups across time can be accepted” (p. 212). However, he found that this was not true when testing different cohorts at the same or different times (pp. 212–215). This is not surprising given that the Flynn effect is moderately negatively correlated with g-loadings (Nijenhuis & Flier, 2013), and that measurement invariance does not hold between representative samples at different times (Wicherts et al., 2004). Cross-sectional studies should probably not be used to study cognitive aging.
One final point is that patterns in the longitudinal data simply do not look like an artefact of practice effects.
Any such effects would have to be much larger than they are typically estimated to be. Studies that give the same subject the same test a few days, weeks, or months apart usually find a gain of around a third of a standard deviation (Jensen, 1998, pp. 314–315). This is much less than what would be needed if fluid intelligence really declines 0.24 SDs between ages 25 and 45 (as in Salthouse’s quasi longitudinal study) rather than increasing by about half a standard deviation (as in longitudinal studies). Indeed, the practice effect on fluid IQ would have to be around three fourths of a standard deviation—more than twice as large as it actually is. What’s more, the 1/3 SD gain is based on studies where tests are given in short succession, whereas in the longitudinal designs they are typically given decades apart. And the only meta-analysis I am aware of found a strong negative relationship between time between tests and the magnitude of practice effects (Hausknecht et al., 2007).
Finally, initial IQ is not related to the rate of decline in longitudinal studies (e.g., Deary et al., 1998), whereas practice effects tend to be larger for those with higher scores at first testing (Jensen, 1980, p. 590).
Conclusion
While longitudinal studies are not perfect, they are much better than the alternatives in this context (cross-sectional and quasi-longitudinal methods). There may be small practice effects, but these are very unlikely to explain the pattern observed in longitudinal studies, namely an increase in both fluid and crystalized intelligence until age 50 or 60, followed by a rapid decline only after age 70.
Consequently, it is reasonable to conclude that the average 70-year-old is more intelligent than the average 20-year-old. And based on the two studies with the longest times between initial testing and follow up, people aged 80 are about one standard deviation more intelligent than they were at age 11.
This essay is adapted from one published at Heretical Insights.
Aaron Dymarskiy is an independent writer who does research on psychometrics, economics and history. He is co-owner of Heretical Insights and can be found on Twitter.
Become a free or paid subscriber:

Like and comment below.
References
Bradway, K. & Thompson, C. (1962). Intelligence at Adulthood: A Twenty-Five Year Follow-Up. Journal of Educational Psychology, 53(1), 1-14.
Corley, J., Conte, F., Harris, S., Taylor, A., Redmond, P., Russ, C., Deary, I., & Cox, S. (2022). Predictors of Longitudinal Cognitive Ageing from Age 70 to 82 Including APOE e4 Status, Early-Life and Lifestyle Factors: The Lothian Birth Cohort 1936. Molecular Psychiatry, 28, 1256-1271.
Dam, F. & Raven, J. (2008). Does the “Flynn Effect” Invalidate the Interpretation Places on Most of the Data Previously Believed to Show a Decline in Intellectual Abilities with Age?, in J. Raven & J. Raven (Eds.) Uses and Abuses of Intelligence: Studies Advancing Spearman and Raven’s Quest for Non-Arbitrary Metrics (pp. 258-287). Royal Fireworks Press.
Deary, I., McLennan, W., & Starr, J. (1998). Is Age Kinder to the Initially More Able?: Differential Ageing of a Verbal Ability in the Healthy Old People in Edinburgh Study. Intelligence, 26(4), 357-375.
Deary, I., Whalley, L., Lemmon, H., Crawford, J., & Starr, J. (2000). The Stability of Individual Differences in Mental Ability from Childhood to Old Age: Follow-up of the 1932 Scottish Mental Survey. Intelligence, 28(1), 49-55.
Deary, I., Whiteman, M., Starr, J., Whalley, L., & Fox, H. (2004). The Impact of Childhood Intelligence on Later Life: Following Up the Scottish Mental Surveys of 1932 and 1947. Journal of Personality and Social Psychology, 86(1), 130-147.
Dickinson, M. & Hiscock, M. (2010). Age-related IQ decline is reduced markedly after adjustment for the Flynn effect. Journal of Clinical and Experimental Neuropsychology, 32(8), 865-870.
Hartshorne, J. & Germine, L. (2015). When Does Cognitive Ability Peak? The Asynchronous Rise and Fall of Different Cognitive Abilities Across the Life Span. Psychological Science, 26(4), 433-443.
Hausknecth, J., Halpert, J., Paolo, N., & Gerrard, M. (2007). Retesting in Selection: A Meta-Analysis of Coaching and Practice Effects for Tests of Cognitive Ability. Journal of Applied Psychology, 92(2), 373-385.
Hiscock, M. (2007). The Flynn effect and its relevance to neuropsychology. Journal of Clinical and Experimental Neuropsychology, 29(5), 514-529.
Hu, Meng. (2025). Spearman’s g Explains Black-White but not Sex Differences in Cognitive Abilities in the Project Talent. OpenPsych, https://doi.org/10.26775/op.2025.07.18.
Jensen, A. (1980). Bias in Mental Testing. The Free Press.
Jensen, A. (1998). The g Factor: The Science of Mental Ability. Praeger Publishers.
Keynes, J. (1936/64). The General Theory of Employment, Interest, and Money. Harper Business.
Larsen, L., Hartmann, P., & Nyborg, H. (2008). The Stability of General Intelligence from Early Adulthood to Middle-Age. Intelligence, 36, 29-34.
Mortensen, E. & Kleven, M. (1993). A WAIS Longitudinal Study of Cognitive Development During the Life Span from Ages 50 to 70. Developmental Neuropsychology, 9(2), 115-130.
McCardle, J., Ferrer-Caja, J., Hamagami, F., Woodcock, R. (2002). Comparative longitudinal structural analyses of the growth and decline of multiple intellectual abilities over the life span. Developmental Psychology, 38(1), 115-142.
Nijenhuis, J. & Flier, H. (2013). Is the Flynn Effect on g?: A Meta Analysis. Intelligence, 41(6), 802-807.
Owens, W. (1953). Age and Mental Abilities: A Longitudinal Study. Genetic Psychology Monographs, 48, 3-54.
Owens, W. (1966). Age and Mental Abilities: A Second Adult Follow-Up. Journal of Educational Psychology, 57(6), 311-325.
Raven, J. (2008). The Raven Progressive Matrices Tests: Their Theoretical Basis and Measurement Model, in J. Raven and J. Raven (Eds.) Uses and Abuses of Intelligence: Studies Advancing Spearman and Raven’s Quest for Non-Arbitrary Metrics (pp. 17-68). Royal Fireworks press.
Salthouse, T. (2010). Major Issues in Cognitive Aging. Oxford University Press.
Salthouse, T. (2019). Trajectories of normal cognitive aging. Psychological Aging, 34(1), 17-24.
Schwartzman, A., Pushkar, D., Andres, D., Arbuckle, T., & Chaikelson, J. (1987). Stability of Intelligence: A 40-Year Follow Up. Canadian Journal of Psychology, 41(2), 244-256.
Tucker-Drob, E., Fuente, J., Köhncke, Y., Brandmaier, A., Nyberg, L., & Lindenberger, U. (2022). A strong dependency between changes in fluid and crystallized abilities in human cognitive aging. Science Advances, 8(5), eabj2422.
Wicherts, J., Dolan, C., Hessen, D., Oosterveld, P., Baal, G., Boomsba, D., & Span, M. (2004). Are intelligence tests measurement invariant over time? Investigating the nature of the Flynn effect. Intelligence, 32(5), 509-537
Wicherts, J. (2007). Group Differences in Intelligence Test Performance.
Woodley, M., Nijenhuis, J., Must, O., Must, A. (2014). Controlling for increased guessing enhances the independence of the Flynn effect from g: The return of the Brand effect. Intelligence, 43, 27-34.
It is difficult to find information on the standard deviation of the Standard Progressive Matrices test, as scores are typically presented in terms of percentiles and not z-scores. However, the few standardization studies that include the SD among the summary statistics typically converge on a range of 7 to 10.
As noted in footnote 1, the SD for the SPM is not generally known.
Whenever possible, the SDs from the initial waves were used.
This is because different tests are normed in different years, so their scale scores are not strictly comparable due to the Flynn effect. They are also typically normed on slightly different populations, and differ in content. Sometimes alternate forms of the same test are produced, which are very similar to each other, but this is not true for most tests produced in the last half century.
Reasoning was indexed with the Letter Sets (basically just the Raven’s Matrices tests except the patterns are made with letters instead of shapes) and the Shipley Abstraction test (somewhat like the Similarities subtest of the WAIS). Vocabulary was measured using the WAIS-III vocabulary subtest, the W-J Picture Vocabulary subtest, and a vocabulary test developed by Salthouse. These two measures had alphas of 0.85 and 0.91, respectively (the former is tied for second highest and the latter is the highest out of the four measures).
In simple terms, measurement invariance means that the instrument you are using to estimate some trait that cannot be directly observed works in the same way in both groups being compared. In this case, the instruments are IQ tests, and the trait of interest is the latent trait g, or the general factor of intelligence.
As far as I know, the best introduction to measurement invariance testing is Jelte Wicherts’ thesis titled Group Differences in Intelligence Test Performance (2007). Meng Hu, who was kind enough to review some portions of this post, has also written a somewhat beginner friendly explanation in his study of race and sex differences in Project Talent data, which is available on his Substack and on OpenPsych (Hu, 2025). See Arthur Jensen’s Bias in Mental Testing (1980) for a description of many different methods of estimating measurement invariance that do not involve factor analysis.
Quote: "The truth, however, is that intelligence actually rises into at least middle adulthood (ages 45–60), regardless of whether it is measured as fluid or crystalized intelligence."
Then how come so many of the theoretical physicists who made fundamental discoveries in the twentieth century were so young: Heisenberg (23), Dirac (24), Pauli (24), Fermi (25), Einstein (26) and so on.
“…so that by the late eighties IQ has declined by something like 10 points relative to age 25.”
I’ve heard these type of findings for many years now. All about the same wrt IQ testing decline across age cohorts. What I’ve never seen is an explanation of just what this means in terms of observable behavioral effects. For example, is a 10 point difference in IQ the same for an individual whose adult lifetime baseline was say, 120-125, as it is in a person whose adult lifetime baseline IQ was 100-105?
For that matter, what exactly does a 10 point difference mean anywhere on the Bell curve? Group averages across time, we have many studies of high vs low, but for individuals…?
I am now at that age you speak of (70’s). My subjective evaluation of myself is that recall (mining the concrete database) is slower and fluid (putting it all together) as well. To this effect, I try to postpone many decisions until I’ve “slept on it”. This seems to work quite well as the mind seems to dwell on such unfinished tasks of the day. YMMV